Gridware indicates a “Reason to Act” to alert the power-user (or operator) that they need to take action. It is important to avoid “false positives” and “known issues”, so that the focus on action is always clear
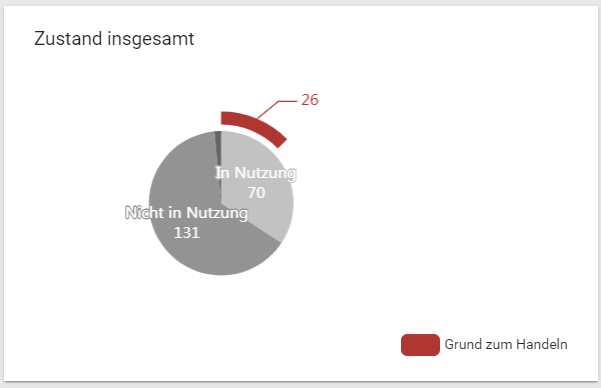
We indicate on the dashboard how many devices have a reason to act. The red bar can be clicked for further details.
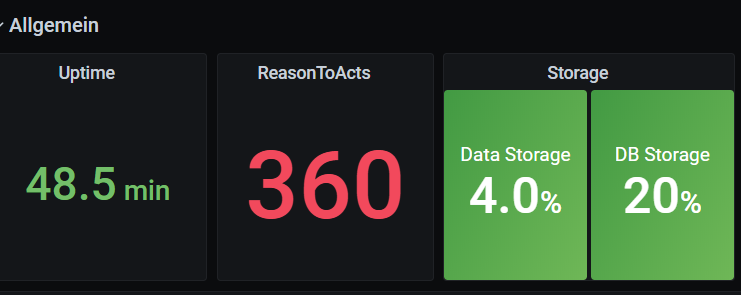
This information we also display in metrics (via via Micrometer). These are used by our dashboards, alarms, but also a energy-provider’s master control station. Here is an example:
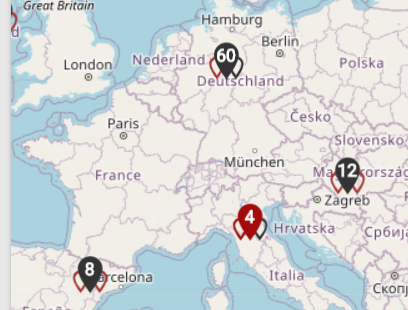
The Reason to Act is also displayed in any map:
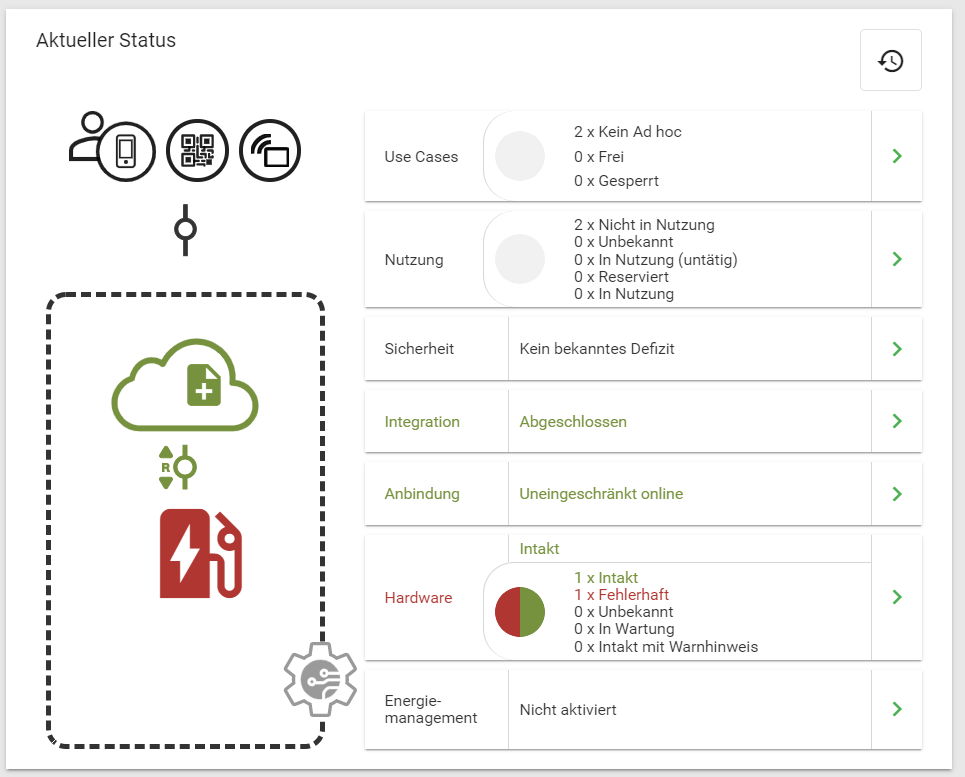
And, of course, in the status graphic
This works even for a duration of hours or even days:

Same with all icons:
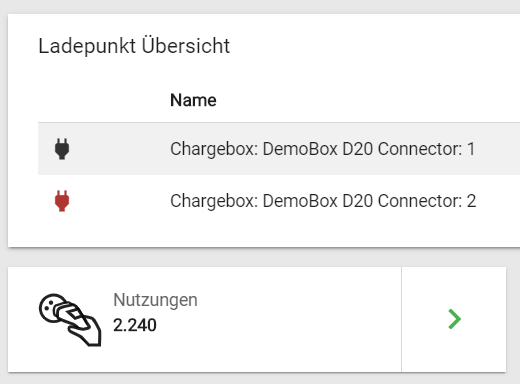
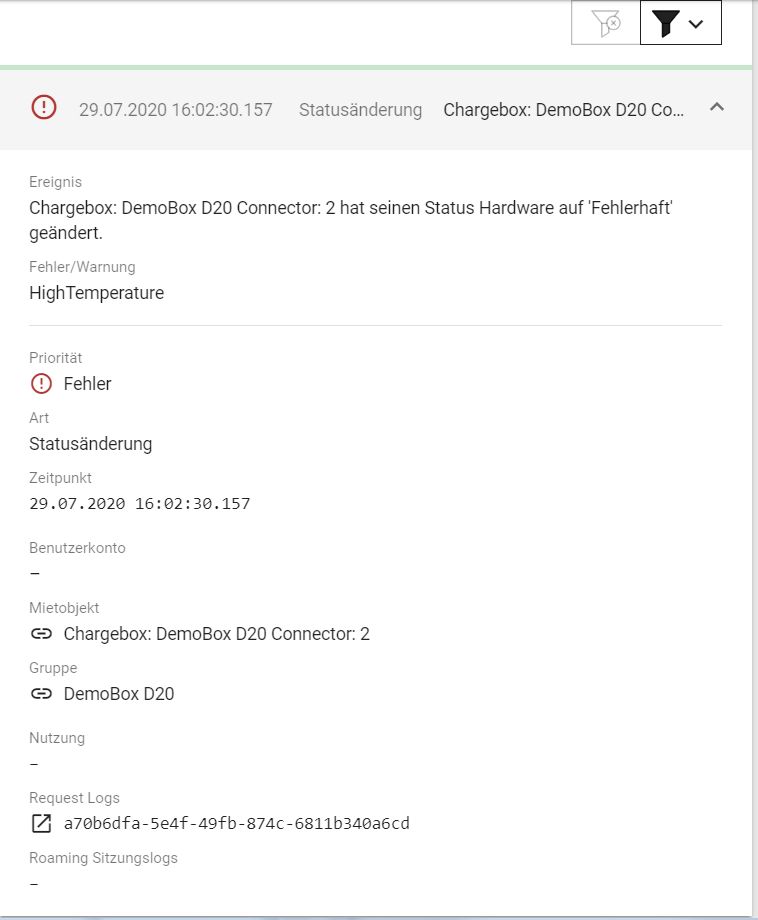
It is nice to have aggregations over hierarchies, geo-positions, different hardware or error scenarios. But aggregations are only useful if the operator can break them down to the concrete event:
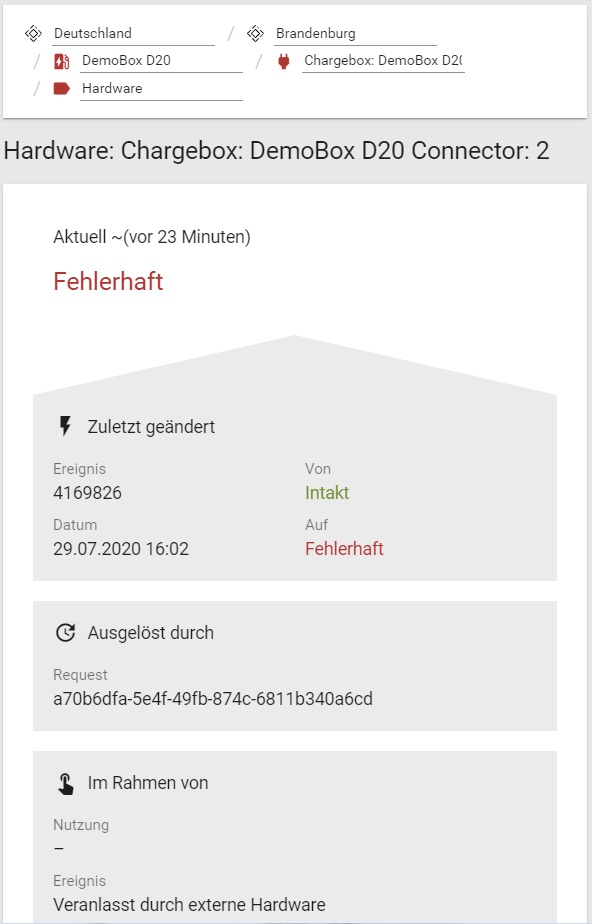
down to the interface:
